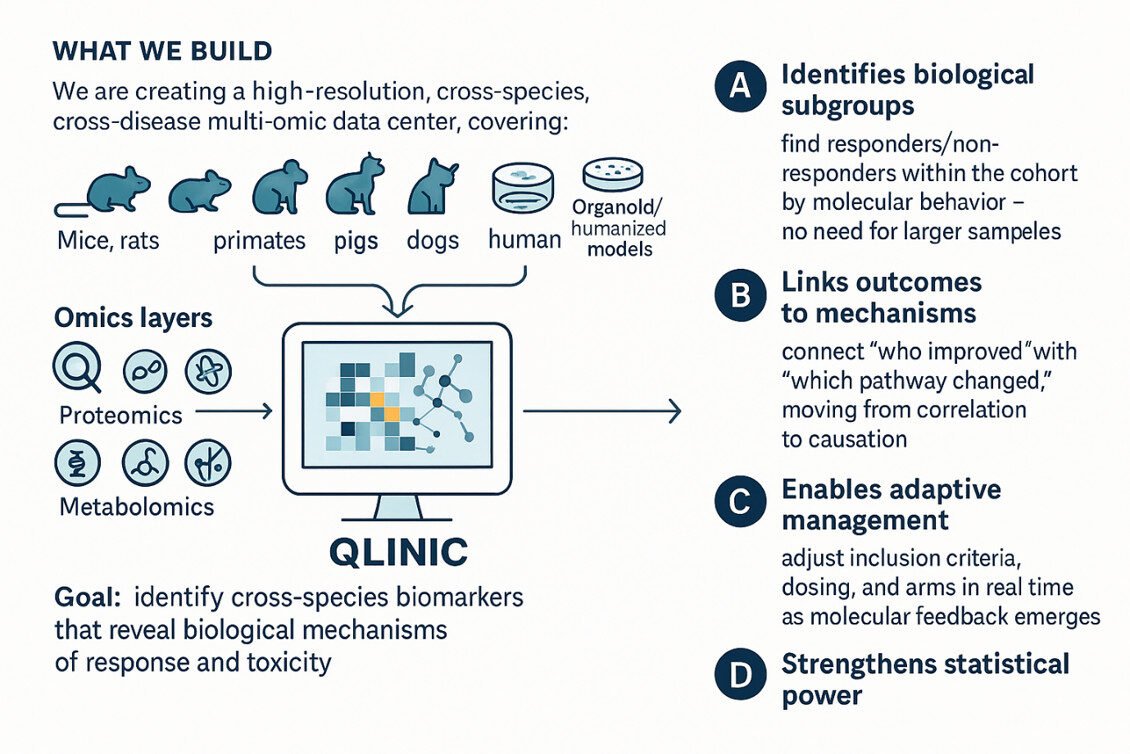
Our Portfolio and Current Assets
QuantumX Labs Own QECC IPCliniQuantum
• Sample size: 200 Patients clinical trial
• X (horizontal axis): Pretreatment IL-6 blood level
(pg/mL) — an inflammatory biomarker measured
before starting the drug.
• Y (vertical axis): Change in symptom score after
8 weeks (Δ score = after–before). Negative value
= clinical improvement.
• Each point: one patient.
• Blue triangles = Responders (≈95%) — showed a
large decrease in the score (improvement).
• Yellow crosses = Non-responders (≈5%) — small
change around zero.
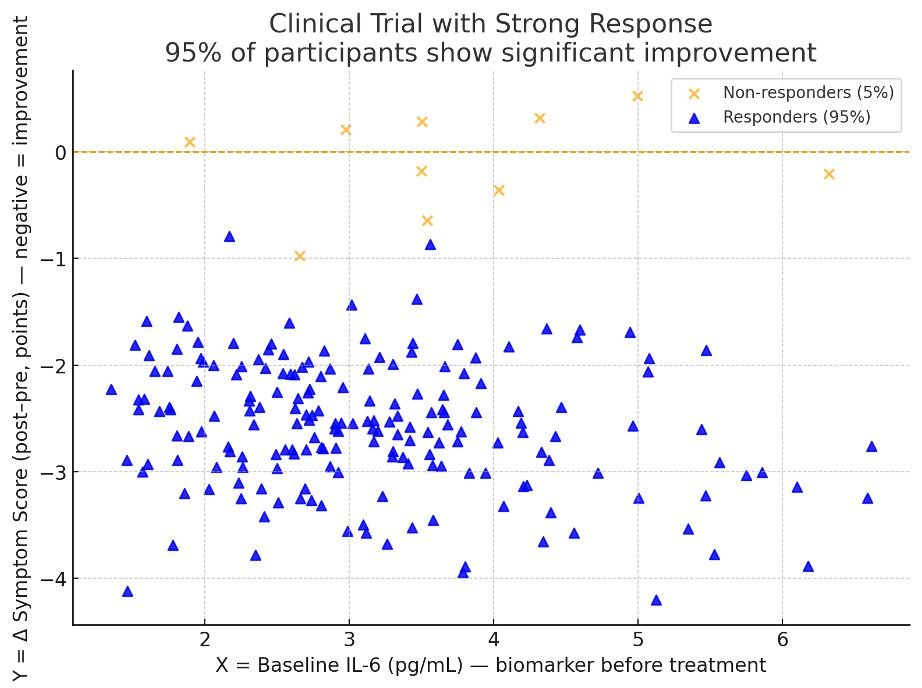
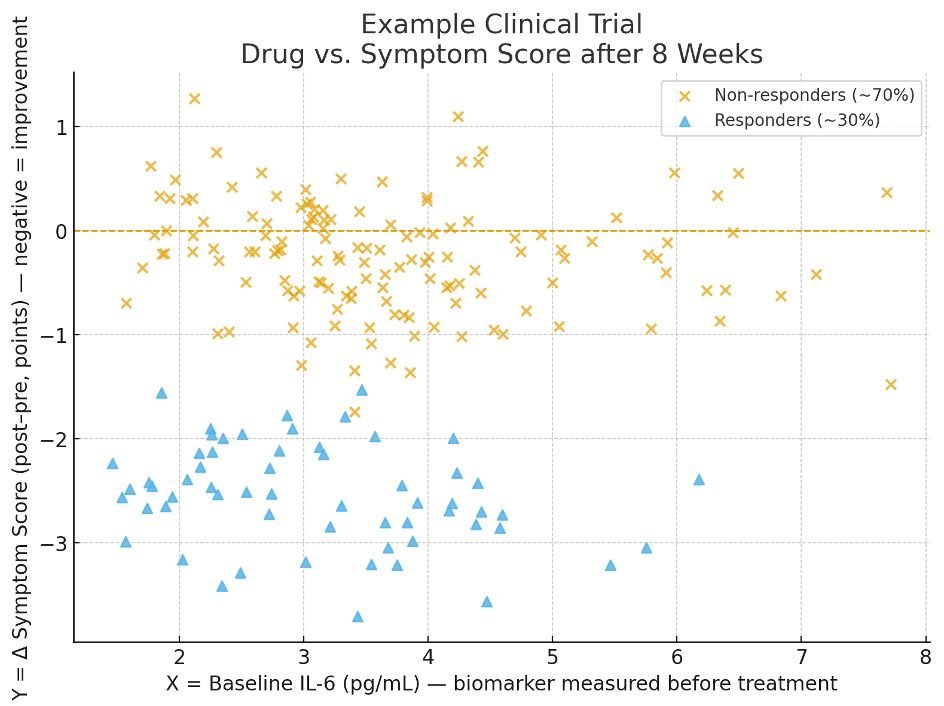
Most participants did not respond, but individuals
did show a strong response.
Classical tools would see this as “noise” or
“anomaly”.
Actual meaning – Clinical trial fail.
CliniQuantum solution:
1. Data enrichment
2. Identification of hidden biological signatures
3. Increase the robustness of statistical
inference in small cohorts
• Blue triangles = Responders (≈30%) — showed a large decrease in the
score (improvement).
• Yellow crosses = Non-responders (≈70%) — small change around zero
Scientific Computing Quantum Algorithms
• Kernal methods
• Sampling and interpolation
• Numerical integration and its applications
For example, in ClinicQuantum, the goal
is to uncover actionable sub-populations
and treatment mechanisms within
existing sample sizes, making trials
smarter, faster, and biologically precise.